
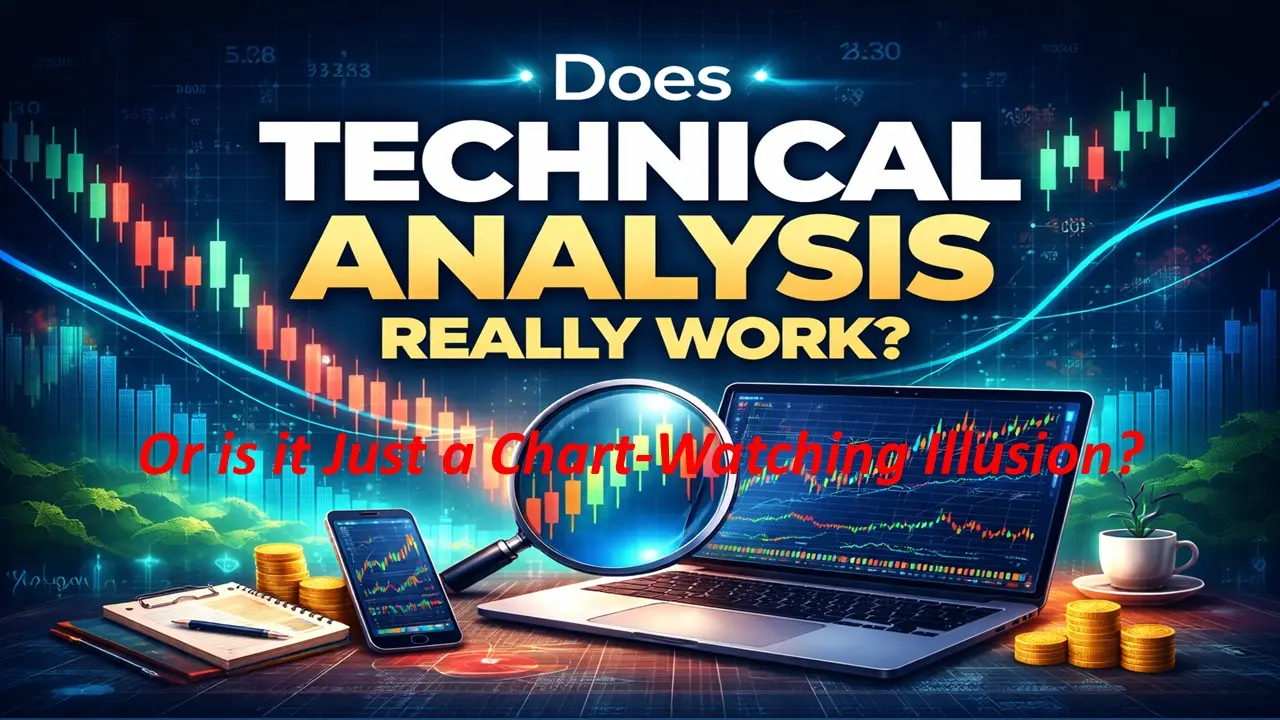
For beginners, looking at stock charts for the first time feels like staring at rocket science — lines, candles, indicators everywhere, and every YouTube video promises:
“Just apply this indicator and 100% profit guaranteed!”
But the real question is:
👉 Does technical analysis really work?
👉 Or is it just an attempt to predict the future using past data?
In this article, we’ll cut through emotions, myths, and marketing hype to explore logic, examples, and real market behavior.
What is Technical Analysis?
Technical Analysis is a method where:
- Share price movements,
- Volume,
- And historical data
are analyzed to predict future price direction.
It assumes the market reflects everything in the price — company performance, news, and investor psychology. Unlike fundamental analysis, it focuses on market behavior and charts rather than a company’s financial health. It’s all about patterns, trends, and probabilities.
What Does Technical Analysis Rely On?
1️⃣ Price Action
Price movements show where the stock is rising or falling, and where momentum is gaining or losing strength. Price action reveals investor sentiment, demand-supply imbalances, and psychological levels. Historical price behavior helps identify entry and exit points, making trading more calculated.
2️⃣ Volume
Volume shows whether price movements are backed by strong participation. Rising price with strong volume indicates genuine strength, while low volume moves may be weak or easily manipulated. Volume helps understand market conviction behind price action.
3️⃣ Patterns
Patterns such as:
- Head & Shoulders
- Double Top / Bottom
- Triangles, Flags, Cup & Handle
visually represent crowd psychology. Patterns help traders identify trend reversals, continuation, or breakouts, supporting probability-based trading decisions rather than certainty.
What Technical Analysis Actually Works On?
Technical analysis works more on human behavior than prices themselves.
Market emotions like:
- Fear
- Greed
- Hope
- Panic
repeat consistently. Charts capture these repeated patterns visually, which technical analysis interprets as support, resistance, or trend behavior, making it a reflection of collective investor psychology.
Example: How Support and Resistance Work
Imagine a stock repeatedly bounces at ₹100. This shows buyers are active at this level and prevent the price from dropping further. Next time the price reaches ₹100, buyers enter again.
Similarly, resistance is where sellers consistently exert pressure. This repeated human behavior forms support and resistance levels, central to technical analysis.
Do Popular Indicators Really Work?
🔹 RSI (Relative Strength Index)
Shows overbought/oversold conditions. RSI signals whether a stock is overextended in buying or selling, but in strong trends, RSI can stay overbought for long periods. Using RSI alone blindly can lead to losses.
🔹 Moving Average (50, 200 DMA)
Smooths historical price data to highlight trends. Large players follow these levels, which sometimes becomes a self-fulfilling prophecy. Moving averages help identify trend direction and potential reversal points.
🔹 MACD
Shows momentum and potential trend changes by comparing moving averages. Useful for identifying reversals, but flat or sideways markets often produce false signals, which can confuse beginners.
Where Technical Analysis Fails
1️⃣ Big News or Events
Unexpected events like budgets, RBI policies, elections, wars, or pandemics can override chart predictions. Technical analysis struggles in such situations and real-time news decisions become essential.
2️⃣ Low Volume Stocks
Penny stocks or operator-driven stocks are easily manipulated. Patterns and indicators often provide misleading signals, resulting in unnecessary losses for traders.
3️⃣ Overuse of Indicators
Using 5–6 indicators simultaneously can produce conflicting signals. Beginners often fail to interpret these correctly, leading to confusion and wrong trading decisions.
❌ Common Misconceptions About Technical Analysis
❌ “Technical analysis is 100% accurate”
Reality: No method can guarantee certainty. Past data only indicates probability, not certainty.
❌ “Indicators tell the whole story”
Reality: Indicators are tools, not decision-makers. They assist, but human judgment and risk management are crucial.
❌ “Charts guarantee daily profits”
Reality: Without proper risk management and discipline, no chart can promise profits.
✅ When Technical Analysis Works Best
- In trending markets with strong volume.
- When risk-reward ratio is clear and stop-loss is strictly followed.
- When combined with fundamental understanding.
This combination improves probability-based trading and helps investors manage entries, exits, and loss control effectively.
Technical vs Fundamental — Which is Better?
| Point | Technical | Fundamental |
| Entry/Exit | Best, short-term focus | Weak, long-term focus |
| Long term view | Weak | Best, evaluates company health |
| Timing | Excellent, reacts to trend | Average, slower adjustments |
| News impact | Weak | Strong, real events matter |
Smart investors often combine both to capture short-term opportunities while ensuring long-term stability.
How Successful Traders Use Technical Analysis
- Not for prediction, but for probability assessment
- Not for blindly following indicators, but for price behavior analysis
- Focus on loss control before profit
Professional traders interpret analysis with discipline and risk management. Amateurs often trade impulsively, relying solely on indicators.
Final Conclusion
👉 Technical Analysis is not magic, but it’s not a scam either.
It is a tool — helpful in skilled hands, dangerous when misused.
With discipline, risk management, and realistic expectations, it provides better entry, exit, and market control.
If you think:
“Just apply indicators and beat the market”
The market will quickly show reality.
📌 In the stock market, survival favors those who master discipline more than analysis.