Ameenji Rubber IPO Overview
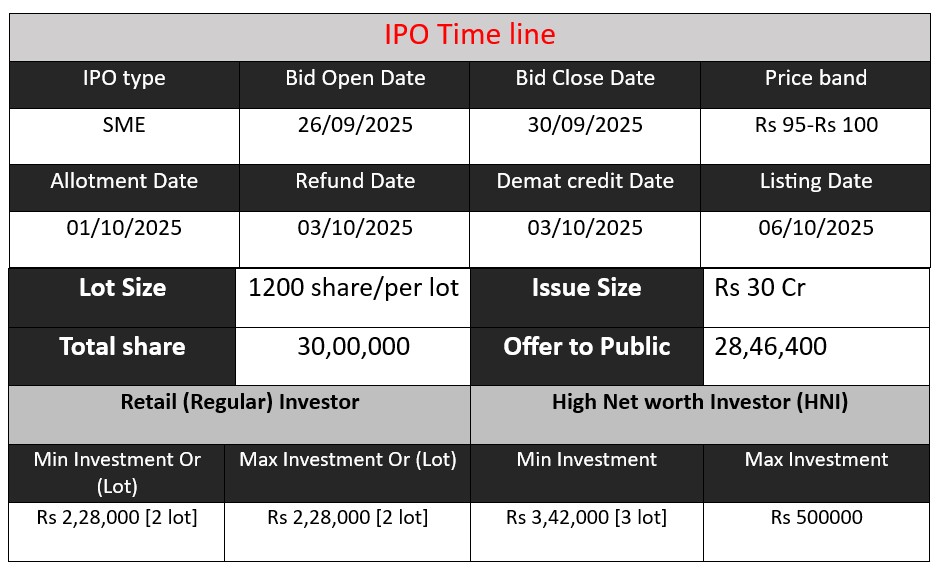
Ameenji Rubber Limited IPO opens on September 26, 2025, and closes on September 30, 2025, with an issue size of ₹30 crore. The IPO comprises 30,00,000 shares, aiming to fund business expansion, enhance manufacturing capacity, and support working capital requirements. Investors get a chance to participate in a leading rubber products manufacturer serving metro, rail, and infrastructure projects across India and abroad.
Ameenji Rubber GMP Status
| GMP (₹) (grey market premium) | IPO Price (₹) |
| 0 | 95-100 |
| Last Updated: 30 Sep 2025 | |
| 📌 Note: The above GMP data is unofficial and has been collected from multiple sources including grey market dealers and market observers. It is provided purely for informational and educational purposes. Please consult your financial advisor before making any investment decisions. | |
IPO Key Detail
Ameenji Rubber Core Business & Overview
Ameenji Rubber Limited is a prominent manufacturer and exporter of specialized rubber products, established in 2006 and headquartered in Secunderabad, Telangana. The company specializes in providing high-quality rubber components for infrastructure and industrial applications across India and internationally.
Certifications: ISO 9001-2008, NABL-accredited laboratory
Manufacturing Facility: 9,993 sq. meters in Hyderabad
Export Reach: Serves over 5 countries, including the USA through its subsidiary Ameenji Rubber Inc. in North Carolina
Ameenji Rubber Limited’s product portfolio includes:
- Elastomeric Bridge Bearings
- POT-PTFE Bearings
- Expansion Joints (e.g., Slab Seal, Compression Seal)
- Rubber Sheets and Mats
- Rubber Speed Breakers
- Cow Mats and Chicken Plucker Rubber Fingers
- Extruded Rubber Profiles
These products are integral to infrastructure projects such as metro systems, flyovers, and bridges, with notable projects including the Ahmedabad, Lucknow, Kolkata, and Chennai metros.
Strengths
- Industry Certifications: Empanelled with the Ministry of Railways (RDSO) and Ministry of Road Transport and Highways (MORTH) for key products
- Diverse Product Range: Over 15 rubber products catering to various applications
- Global Presence: Export operations in multiple countries
- Robust Manufacturing Infrastructure: State-of-the-art facility with a capacity to manufacture 10–14 tonnes of products daily
- Quality Assurance: In-house NABL-accredited laboratory ensuring stringent quality control
Risks
- Sectoral Dependency: High reliance on government infrastructure and railway projects, making revenue sensitive to public spending cycles
- Raw Material Volatility: Fluctuations in raw material prices (accounting for 64–80% of costs) can impact profitability
- Working Capital Intensity: The business model requires significant working capital, posing liquidity challenges
- Competition: Facing competition from both domestic and international rubber product manufacturers
- Regulatory Exposure: Subject to changes in industry standards and regulations affecting product approvals
Financial Performance Overview (₹ in Crore)
| Financial Metric | FY 2023 | FY 2024 | FY 2025 |
| Revenue | 74.08 | 83.34 | 94.05 |
| Profit | 3.50 | 4.31 | 8.03 |
| Assets | 55.18 | 76.20 | 102.83 |
Revenue
- Revenue has steadily increased from ₹74.08 crore in FY23 to ₹94.05 crore in FY25.
- Growth Rate FY23–FY24: (83.34−74.08)/74.08×100(83.34 − 74.08)/74.08 × 100(83.34−74.08)/74.08×100 = 12.5%
- Growth Rate FY24–FY25: (94.05−83.34)/83.34×100(94.05 − 83.34)/83.34 × 100(94.05−83.34)/83.34×100 = 12.8%
Consistent double-digit revenue growth indicates strong demand for the company’s products and expanding market presence.
Profit
Profit increased from ₹3.50 crore in FY23 to ₹8.03 crore in FY25.
- Profit Growth FY23–FY24: (4.31−3.50)/3.50×100(4.31 − 3.50)/3.50 × 100(4.31−3.50)/3.50×100 = 23%
- Profit Growth FY24–FY25: (8.03−4.31)/4.31×100(8.03 − 4.31)/4.31 × 100(8.03−4.31)/4.31×100 = 86.3%
Profit is growing at a faster pace than revenue, suggesting improved operational efficiency and better cost management.
Asset
- Total assets grew from ₹55.18 crore in FY23 to ₹102.83 crore in FY25.
- Asset Growth FY23–FY24: (76.20−55.18)/55.18×100(76.20 − 55.18)/55.18 × 100(76.20−55.18)/55.18×100 = 38%
- Asset Growth FY24–FY25: (102.83−76.20)/76.20×100(102.83 − 76.20)/76.20 × 100(102.83−76.20)/76.20×100 = 35%
The company is significantly investing in assets, likely for capacity expansion, infrastructure, and export readiness.
Disclaimer:
The above IPO analysis and financial data are based on information provided by the company in its official documents. For complete details, please refer to the Red Herring Prospectus (RHP) linked above. Investors are strongly advised to consult their financial advisor before making any investment decisions.