Jain Resource Recycling IPO Overview
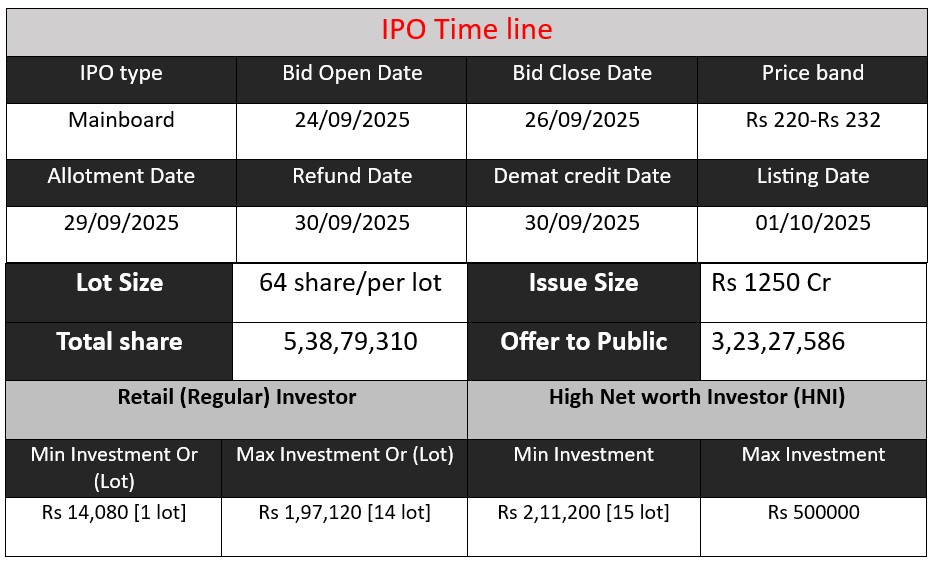
Jain Resource Recycling is launching an IPO with a ₹1,250 crore issue size, comprising a fresh issue of ₹500 crore and an OFS of ₹750 crore. The IPO opens on 24 September 2025 and closes on 26 September 2025, with a price band set at ₹220–232 per share and minimum lot size of 64 shares. Proceeds will be used for debt repayment and general corporate purposes.
Jain Resource Recycling GMP Status
| GMP (₹) (grey market premium) | IPO Price (₹) |
| 3.5 | 220-232 |
| Last Updated: 26 Sep 2025 | |
| 📌 Note: The above GMP data is unofficial and has been collected from multiple sources including grey market dealers and market observers. It is provided purely for informational and educational purposes. Please consult your financial advisor before making any investment decisions. | |
IPO Key Detail
Jain Resource Recycling Core Business & Overview
Jain Resource Recycling Limited is part of the Jain Metal Group, operating in the non-ferrous metal recycling space.
The company was incorporated in 2022 as a private limited company when reconstituted from earlier entities; its roots go back to 1953 (originally Jain Metal Rolling Mills).
It is headquartered (or at least its main recycling facilities) in the SIPCOT Industrial Estate, Gummidipoondi, Chennai, India. It has three recycling plants there, plus a segregating facility in Hosur (Tamil Nadu).
The company manufactures products from non-ferrous scrap: lead and lead alloy ingots; copper and copper ingots; aluminium and aluminium alloys; and had some operations in precious metals (gold/silver) via a subsidiary in Sharjah (UAE), though those refining operations were discontinued in April 2025.
Here are the main activities and how the business works:
- Scrap Procurement & Recycling
- The company sources scrap (copper, lead, aluminium) both domestically and via imports. Over recent years, a large portion of raw materials are imported.
- The recycling process includes sorting, cleaning, melting/refining, casting into ingots or alloys, etc., to produce usable metal products.
- Product Types & Markets
- Key products are lead & lead alloy ingots, copper and copper ingots, aluminium and aluminium alloys. Precious metals (gold/silver) were part of offerings but have been scaled back.
- The products serve customer industries like lead-acid batteries, electrical & electronics, automotive, pigments, among others.
- Scale & Export Orientation
- As of FY25 (the year ending March 2025), exports made up about 60.39% of revenue; FY24 54.11%; FY23 51.63%.
- The facilities’ combined production capacity is ~64,619 metric tonnes per annum (MTPA) as of 31 July 2025; plus a smaller Hosur facility of 88 MTPA.
- Certifications & Quality Credentials
- Their lead ingots are registered with the London Metal Exchange (LME).
- They have ISO certifications (ISO 9001, ISO 14001, ISO 45001) and a NABL-accredited lab for testing.
Strengths
Here are several strengths the company has, based on recent reports and analyst commentary:
- Export Orientation & Global Reach
- Over 60% of its revenue comes from exports, giving access to global demand and potentially better margins.
- The experience in sourcing raw materials from over 120 countries gives them a wide procurement base.
- Product Mix & Quality Recognition
- Being LME-registered for lead ingots is a significant differentiator (helps in international markets).
- Their ability to manufacture across multiple non-ferrous metals (copper, aluminium, lead) reduces dependency on one metal.
- Strong Revenue Growth & Improving Profits
- The financial growth seen in recent years shows robust scaling of operations.
- Margins are improving, as is the operating performance.
- Risk Management Practices
- The company uses hedging (e.g. futures on LME) to mitigate commodity price risk.
- Also some natural hedge in foreign exchange, since both imports (raw materials) and exports are large parts of business.
Risks
Here are key risks and challenges cited by analysts, IPO documents, and rating agencies:
- Dependency on Key Products & Customers
- A large portion of revenue comes from lead & lead alloy ingots and copper & copper ingots (together 84-90% depending on FY). If demand falls or prices are volatile, this disproportionately impacts them.
- Also, top customers (top 5-10) account for a large share of revenue. Loss of any key client or shift in their sourcing could hurt business.
- Raw Material / Supply Risks
- Heavy dependence on imported scrap (75-80%) exposes them to supply chain disruptions, trade policy changes, currency fluctuations, import duties, etc.
- Quality of scrap, contamination, logistics, and consistency could be issues. Maintaining quality standards for export clients can be demanding.
- Regulatory / Environmental / Quality Risks
- Environmental norms tightening, regulatory oversight in recycling could add cost or require capital investments. Compliance is essential.
- Quality non-compliance risk: customer cancellations or reputational loss if quality lapses.
- Financial Leverage / Borrowings
- The company has significant borrowing; servicing debt, especially under adverse interest rate or operational cost scenarios, could stress financials.
- Commodity Price & Foreign Exchange Volatility
- As metals are commodities, their global prices fluctuate. Since the company imports a lot of scrap and exports a lot of product, both commodity and currency risk matter.
Financial Performance Overview (₹ in Crore)
| Financial Year | Revenue | Profit | Assets |
| FY 2023 | 3,064.07 | 91.81 | 1,115.95 |
| FY 2024 | 4,428.42 | 163.83 | 1,528.75 |
| FY 2025 | 7,125.77 | 223.29 | 1,836.24 |
Revenue
The company’s revenue shows consistent and sharp growth:
- 44.6% increase from FY 2023 → FY 2024
- 60.9% increase from FY 2024 → FY 2025
This indicates strong demand, capacity utilization, and possible expansion in exports and product mix.
Profit
Profit growth is also significant:
- 78.4% growth FY 2023 → FY 2024
- 36.3% growth FY 2024 → FY 2025
Even though revenue growth was higher in FY 2025, profit growth was slower, suggesting rising costs, tighter margins, or higher finance costs.
Total Assets
Assets have been steadily increasing:
- 37% growth FY 2023 → FY 2024
- 20% growth FY 2024 → FY 2025
This indicates continued capital investment to support expansion, but the growth rate of assets is slower than revenue growth, showing efficient asset utilization.
Disclaimer:
The above IPO analysis and financial data are based on information provided by the company in its official documents. For complete details, please refer to the Red Herring Prospectus (RHP) linked above. Investors are strongly advised to consult their financial advisor before making any investment decisions.