Indiqube Spaces IPO Overview
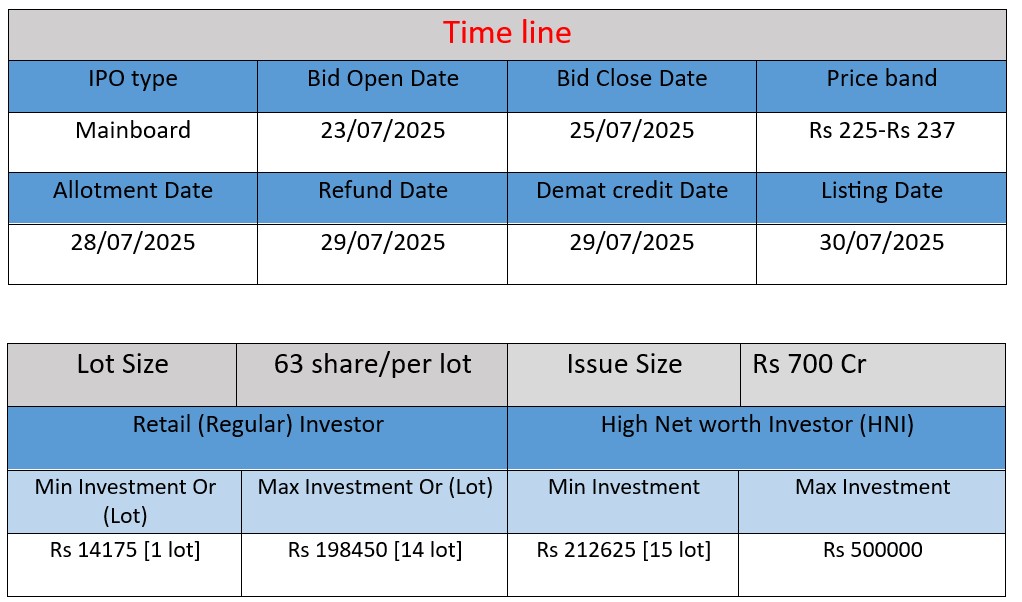
IndiQube Spaces IPO opens Jul 23–25, 2025, with a ₹700 cr issue—₹650 cr fresh equity + ₹50 cr OFS. Price band ₹225–237/sh, lot size 63 shares (~₹14,931). ₹462.6 cr to fund new centre capex, ₹93 cr for debt repayment, rest for general corporate purposes. Quota: QIB 75%, NII 15%, Retail 10%, Employee ₹1.5 cr. Anchor book opens Jul 22; listing tentatively on Jul 30
Indiqube Spaces IPO Subscription status
| Subscription Rate Source: NSE/BSE | |||
| Category | Shares Offered | Shares Bid For | Subscription (x) |
| QIBs | 93,13,334 | 13,36,68,801 | 14.35x |
| NIIs | 46,56,666 | 3,83,90,877 | 8.24x |
| Retails | 31,04,444 | 3,89,51,892 | 12.55x |
| Employees | 73,891 | 4,84,722 | 6.56x |
| Total | 1,71,48,335 | 21,14,96,292 | 12.33x |
| Last Updated: 25 July 2025 Time: 5 PM (Note: This data is updated every 2 hours) Get instant updates on WhatsApp – Join now! | |||
IPO Key Date
Core Business & Overview
IndiQube Spaces, founded in 2015 (originally Innovent Spaces Pvt. Ltd.), positions itself as a technology‑driven and sustainable flexible workspace provider. It offers office solutions—including interior design, facility & IT management, F&B, transport, and more—via its proprietary MiQube platform, across a “hub & spoke” model covering 115 centres in 15 Indian cities and managing 8.4 million sq ft with ~187k seats.
They typically lease full buildings (65%+ of portfolio), refurbish Grade B properties into smart green workspaces, and serve both B2B and B2C, notably Global Capability Centers (GCCs).
Strengths
- Leading pan‑India presence in the fast-growing flexible workspace market—115 centres, strong foothold in metro cities like Bengaluru, Pune, Chennai.
- Asset-light & capital-efficient model, leasing large buildings, rapid 45-day fit-outs, renovation focus tied with sustainable certifications (36%+ area certified).
- Diversified value-added service suite, tech integration via MiQube, forward/backward vertical integration.
Potential Risks
- Geographical revenue concentration—~89% of operations in Bengaluru, Pune & Chennai; adverse events there could heavily impact results.
- Exposure to real estate cycles, with sensitivity to commercial lease rates and property valuations; occupancy dipped from 83.7% to 80.2% in FY24.
- Consistent net losses—though narrowing, the company posted net losses in FY23‑25 (–₹198 cr, –₹342 cr, –₹140 cr).
- Lease dependency risk—relies on leased assets (64.7%), with concerns over rent defaults or title issues; 22.4% of leases unregistered.
- Capital and working‑capital intensity, with ongoing capex (~₹1,507/sq ft) and potential need for future funding.
- Competitive pressure—faces rival operators like Awfis, Smartworks, WeWork India in a fragmented market of over 500 players.
Outcome
IndiQube Spaces is a leading, technology-enabled flexible workspace operator with strong scale, operational efficiency, and a comprehensive service ecosystem. It’s executing a capital-efficient hub-and-spoke model and expanding rapidly with solid backing and sustainable initiatives. Nevertheless, its financial loss history, real estate and lease dependencies, and market concentration in a few cities remain notable risk factors. Investors bullish on the growth of the flexible office space sector—and comfortable with its current loss profile—may find IndiQube a compelling play, while risk-averse stakeholders may prefer to wait for sustained profitability and geographical diversification.
Financial Performance Analysis (in ₹ Crore)
| Metric | FY 2023 | FY 2024 | FY 2025 |
| Revenue | 579.74¹ | 867.66 | 1,102.93 |
| Net Profit /(Loss) | –198.11 | –341.51 | –139.62 |
| Total Assets | 2,969.32 | 3,667.91 | 4,685.12 |
Revenue
- Strong upward trajectory: +50% in FY23 → FY24, then +27% in FY24 → FY25. FY25 marks ₹1,102.93 cr, a 27% increase from ₹867.66 cr in FY24.
Profitability
- After deepening losses into FY24 (–₹341.51 cr), FY25 shows significant improvement with loss narrowing to –₹139.62 cr.
- Indicates progress toward breakeven, though still negative.
Asset
- Total assets have grown ~58% over three years (₹2,969 cr → ₹4,685 cr), reflecting capital-intensive growth strategy (leasing, fit-outs).
Summary :
- Robust Top-Line Expansion: Revenue nearly doubled since FY23, fueled by rapid expansion (from 74 to 115 centers), higher occupancy, and increased value-added services.
- Path Toward Profitability: Profit improvement in FY25 is notable. However, the company remains loss-making—stability hinges on optimizing cost, scale, and margin improvement.
- Asset-Heavy Model: The rising asset base signals aggressive investment in property leases and capex. While this supports growth, it also heightens balance sheet leverage and risk.
Disclaimer:
The above IPO analysis and financial data are based on information provided by the company in its official documents. For complete details, please refer to the Red Herring Prospectus (RHP) linked above. Investors are strongly advised to consult their financial advisor before making any investment decisions.