हिंदी में पढ़ने के लिए मेनू बार से हिंदी भाषा चयन करें।
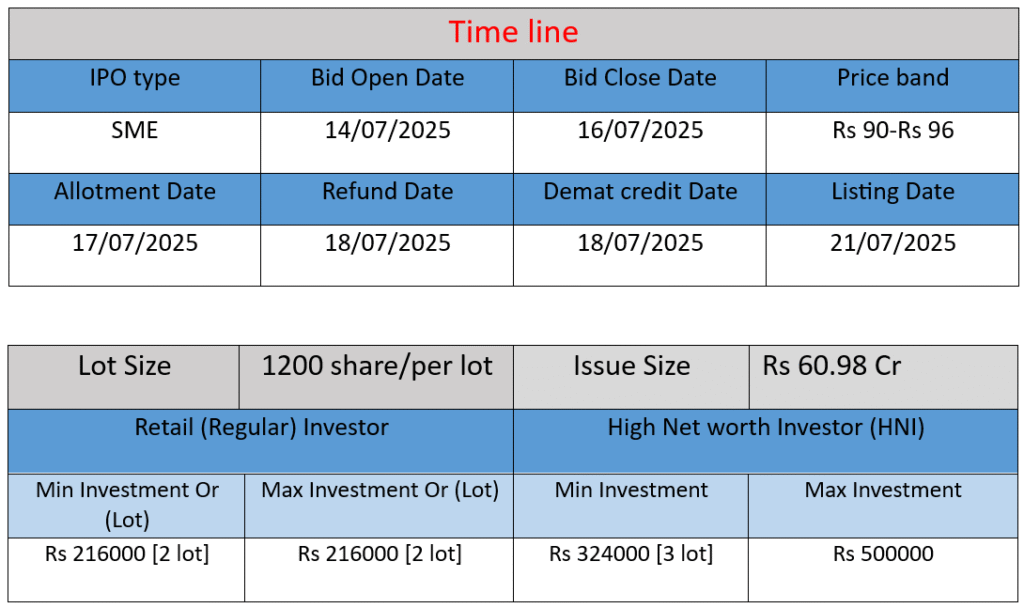
Spunweb Nonwoven Ltd. SME IPO opens July 14 and closes July 16, 2025, offering 6.35 million fresh equity shares at ₹90–₹96 each, aiming to raise approximately ₹60.98 Cr. Funds will support working capital needs, subsidiary investment, debt repayment, and general corporate purposes. NSE‑SME listing expected on July 21, 2025.
Subscription Rate
Sources data: NSE/BSE
| Category | Subscription (x) |
| QIBs | 165.43x |
| NIIs | 364.60x |
| Retails | 249.00x |
| Total | 231.93x |
| Last Updated: 16 July 2025 Time: 5 PM (Note: This data is updated every 2 hours) | |
Core Business & Overview
- Foundation & Facilities: Incorporated in August 2015, Spunweb operates two manufacturing units in Rajkot, Gujarat, using five spunbond production lines with a combined installed capacity of 32,640 MT per annum.
- Product Range: Specializes in polypropylene spunbond nonwoven fabrics—hydrophobic/hydrophilic, super-soft, UV-treated, flame-retardant, antistatic—in widths of 1.6 m to 3.2 m and GSM from 7–150. They also offer value-added services like lamination, slitting, coating, printing, and sheet cutting.
- End Markets: Supplies fabrics for hygiene (diapers, sanitary pads, liners), medical (face masks, PPE, surgical gowns), packaging, agriculture, roofing, construction, and industrial home furnishings.
Strengths
- Leadership in Scale: Among India’s top spunbond nonwoven fabric producers, with substantial capacity and diverse production lines tailored per industry segment.
- Diverse & Global Customer Base: Serves over 485 domestic and 20+ international clients—including the US, UAE, Italy, Egypt, Saudi Arabia, Africa—with established relationships in hygiene and healthcare.
- Quality Assurance & ESG Initiatives: ISO 9001:2015 certified; equipped with clean-room environments and in‑house testing labs. Sustainability focus with rooftop solar installations (1.53 MW total) reducing energy footprint.
Potential Risks & Weaknesses
- Suboptimal Capacity Utilization: Utilization at only ~67–73%, meaning possible inefficiencies or slower absorption of fixed costs.
- Heavy Debt Load: Borrowing totals ~₹91 cr vs. net worth ~₹45 cr—Debt/Equity ratio elevated (~2.0), which heightens financial risk.
- Dependence on Key Suppliers & Customers: Lacks long-term supply contracts; any disruption could affect costs and availability. A few large customers and over two-thirds of revenue coming from hygiene could concentrate exposure.
- SME Listing Constraints: Limited liquidity and visibility compared to mainboard peers may impact investor interest and share performance.
Out come:
Spunweb Nonwoven boasts strong fundamentals: market-leading capacity, excellent product quality, solid client relationships, and strong growth metrics. Yet constraints like under-utilized capacity, elevated debt, supplier/customer concentration, and SME listing limitations pose notable risks. Its proactive strategy—featuring capital infusion, margin improvement, and diversification—seeks to strengthen its position. Investors and partners should weigh the sizable growth potential against these operational and financial risks.
Financial Performance Analysis (in ₹ Crore)
| Financial Year | Revenue | Profit | Assets |
| FY-2023 | 115.92 | 1.13 | 93.15 |
| FY-2024 | 148.61 | 5.44 | 106.58 |
| FY-2025 | 226.35 | 10.79 | 182.76 |
Revenue
- FY-2023: ₹115.92 crore
- FY-2024: ₹148.61 crore → 📈 28.15% growth
- FY-2025: ₹226.35 crore → 📈 52.27% growth
Analysis: Company has shown consistent and strong revenue growth. The growth rate accelerated significantly in FY-2025, likely due to capacity utilization, product diversification, and better client acquisition.
Profit
- FY-2023: ₹1.13 crore
- FY-2024: ₹5.44 crore → 📈 381.4% growth
- FY-2025: ₹10.79 crore → 📈 98.3% growth
Analysis: The profit has surged impressively, especially in FY-2024. The improvement in profitability suggests better operational efficiency, higher margins, or scale benefits. FY-2025 profit doubling again reflects continued momentum.
Total Assets
- FY-2023: ₹93.15 crore
- FY-2024: ₹106.58 crore → 📈 14.4% growth
- FY-2025: ₹182.76 crore → 📈 71.5% growth
Analysis: The significant jump in assets in FY-2025 indicates capital investment, expansion of infrastructure, or inventory buildup in preparation for future growth.
Summary
- Company’s revenue nearly doubled in just two years.
- Profit grew almost 10 times between FY-2023 and FY-2025.
- Strong improvement in asset base, possibly due to IPO preparation or business expansion.
- Financials indicate strong growth trajectory, increased investor confidence, and robust operational performance.
Disclaimer:
The above IPO analysis and financial data are based on information provided by the company in its official documents. For complete details, please refer to the Red Herring Prospectus (RHP) linked above. Investors are strongly advised to consult their financial advisor before making any investment decisions.